How to debug Netlify serverless lambda functions using VS Code for your JAMstack app
The JAMstack is a modern web development architecture based on client-side JavaScript, reusable APIs, and prebuilt Markup. JAMstack applications are practically serverless. To put it more clearly, we do not maintain any server-side applications but rather use existing services (like email, media, database, search, and so on).
Netlify serverless functions are an extremely flexible way to become practically serverless. It is hassle-free to set it up and get it running. As a developer of these functions, it is an implicit requirement. We should know how to debug them when a painful situation arises. I haven’t found many resources on the internet that explain this debugging setup in a step-by-step manner. That’s why I wrote this article.
If you use code editors like Visual Studio Code(VS Code), it should be easier to set up. In this article, we will learn how to debug Netlify Functions using VS Code.
Netlify Serverless Function
Netlify functions are Powered by AWS Lambda. Using the AWS Lambda serverless function, we can run server-side code without running a dedicated server. However, creating an AWS account, managing service discovery, configuring API gateways, etc., could be overwhelming for someone who wants to stick to the business logic.
Netlify lets us deploy serverless Lambda functions without an AWS account. Netlify takes all the underlying management part care. You can learn more about managing serverless functions from here.
Here is an example of a simple serverless function,
exports.handler = async (event, context) => {
  const { id } = JSON.parse(event.body);

   // make an API call, send an email, search,
  // media, everything!
  const { data, errors } = await query(query, { id });

  if (errors) {
    return {
      statusCode: 500,
      body: JSON.stringify(errors)
    };
  }

  return {
    statusCode: 200,
    body: JSON.stringify({ item: data.deleteItem })
  };
};
Netlify deploys these functions as full API endpoints. These functions receive request context or event data and return the client's response data (like UI application) to consume.
How to Debug Netlify Function using VS Code
Assuming you are already using VS Code editor for development, you may find this section straightforward and simple to understand.
Step 1: To get started with the debugging, we need to install the netlify-cli command-line tool. Open a command prompt at the project root directory and execute this command to install netlify-cli locally to your project.
npm install netlify-cli --save-dev
To install it globally, use this command,
npm install -g netlify-cli
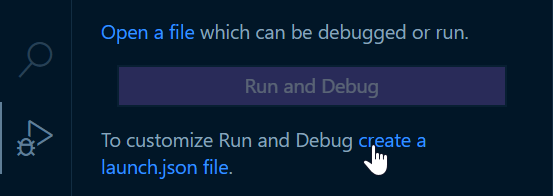
Step 2: Create a launch file. Click on the ‘Run’ option from the left menu and then click on the link, “create a launch.json file” as shown in the image below.
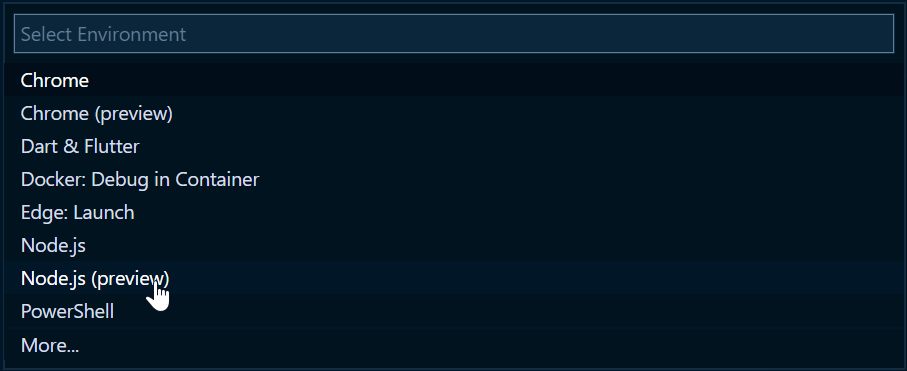
Step 3: A list of options will appear to select from. Please select the option, Node.js(preview). If you are on an older version of the VS Code and the preview environment is not available, please select Node.js instead.
Step 4: A Launch.json file will be created with the following content. If you had selected a ‘Node’ environment in the last step, you would see the type as, ‘node’.
{
    // Use IntelliSense to learn about possible attributes.
    // Hover to view descriptions of existing attributes.
    // For more information, visit: https://go.microsoft.com/fwlink/?linkid=830387
    "version": "0.2.0",
    "configurations": [
        {
            "type": "pwa-node",
            "request": "launch",
            "name": "Launch Program",
            "skipFiles": [
                "<node_internals>/**"
            ],
            "program": "${file}"
        }
    ]
}
Change the file content to the content shown below. If you already have an existing Launch.json file, edit that to add the below configuration.
{
    "version": "0.2.0",
    "configurations": [
      {
        "name": "Netlify Debugging",
        "type": "pwa-node",
        "request": "launch",
        "program": "${workspaceFolder}\\node_modules\\.bin\\netlify",
        "runtimeArgs": ["run-script", "debug"],
        "runtimeExecutable": "npm",
        "skipFiles": ["<node_internals>/**"],
        "resolveSourceMapLocations": [
            "${workspaceFolder}/**",
            "!**/node_modules/**"
        ]
      }
    ]
  }
Please note, if you set the type to ‘node’ instead of ‘pwa-node’ the ‘resolveSourceMapLocations’ array will not work. You can remove it. The ‘resolveSourceMapLocations’ config parameter makes sure we do not get unnecessary warnings for not having the source map files inside the node_modules folder.
You may also not need the program attribute in the configuration if netlify-cli is installed globally.
Step 5: Open the package.json file and add this entry under the scripts section,
"debug": "netlify dev --inspect"
Step 6: We are all set. We need to start the debugging. To start the debugging, click on the play icon at the left side-bar.

Step 7: Set breakpoints as required.

Step 8: Click on the play button at the left-top corner to start the debugging.
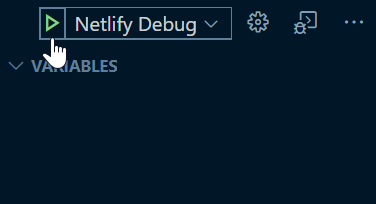
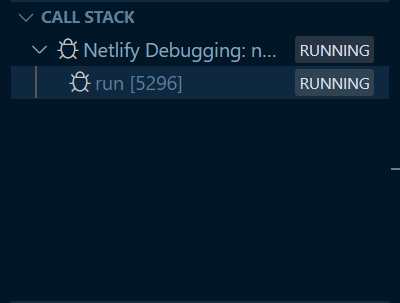
You should see an item appearing in the ‘CALL STACK’ section to indicate. We are ready to debug. A browser window will also pop open at this stage with the Netlify URL. By default, it is, http://localhost:8888. You can leave that window as it is.
Step 9: The Debug Console log will also print about running Netlify functions in the debug mode.

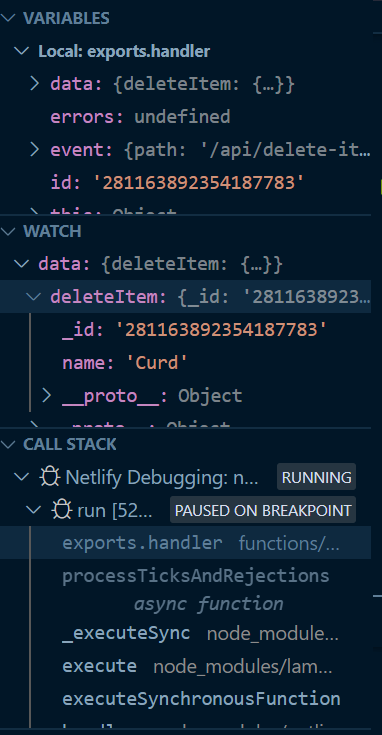
Step 10: When you make an API call(using the user interface or any tools like PostMan), you should see the code execution paused at the breakpoint.

Step 11: At this time, you can inspect the variable values, check the scopes, etc., from the left-side panels, as shown in the image below.
Step 12: Last but not least, you can control the debugging(Stepping through, coming out of the debug mode, etc.) from this control.

Before you go…
Thank you for reading this far! Let’s connect. You can @ me on Twitter (@tapasadhikary) with comments, or feel free to follow.
You may also like,
- Tricks and Tips: Debugging your website from Android Devices
- JAMstack for All: An Introduction
- JAMstack vs traditional monolithic workflow
- What is a Static Site Generator and how to select one?
- How to use JAMstack with the server side and enterprise app
- Have you looked into MS Visual Studio Code's Web Template Studio yet?