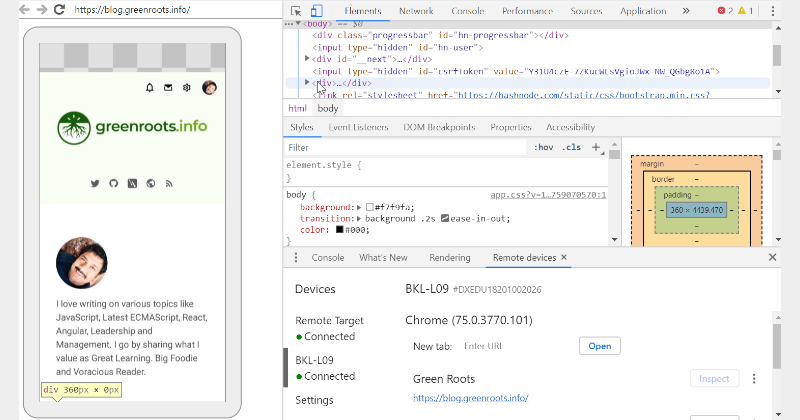
Tricks and Tips: Debugging your website from Android Devices
In many cases, we develop the web app once and expect it to work on all the target devices. At times, there could be issues that are seen only in the browsers running on the devices. These issues could be related to, Page Structure, Style, Network Calls failing, etc.
At that time, we feel a need(or wish) if we could open up the Chrome Debugger Tool from Android Devices(Mobiles, Tablets, etc.) to debug things and find out the issues.
Well, the good news is, It is Possible! In case you are not aware, you can set up any of your android devices for Remote Debugging to Debug your websites/apps running on Android's Chrome Browser.
Below are the quick steps to explain how to set it up and use it. Keep exploring!
Make your Android device Debug Ready
- Find Developer options on your phone. In most recent Android OS versions, it can be found under Settings > System > Developer Options.
- If Developer options is not visible, select Settings > About device and tap the Build number seven times. Return to the above step, and Developer options should now be visible.
- Connect your phone to a Laptop/PC with a USB Cable.
Scroll under Developer option as you will see an option to enable USB debugging. Please enable it. You may get a confirmation dialog. Accept it to proceed.
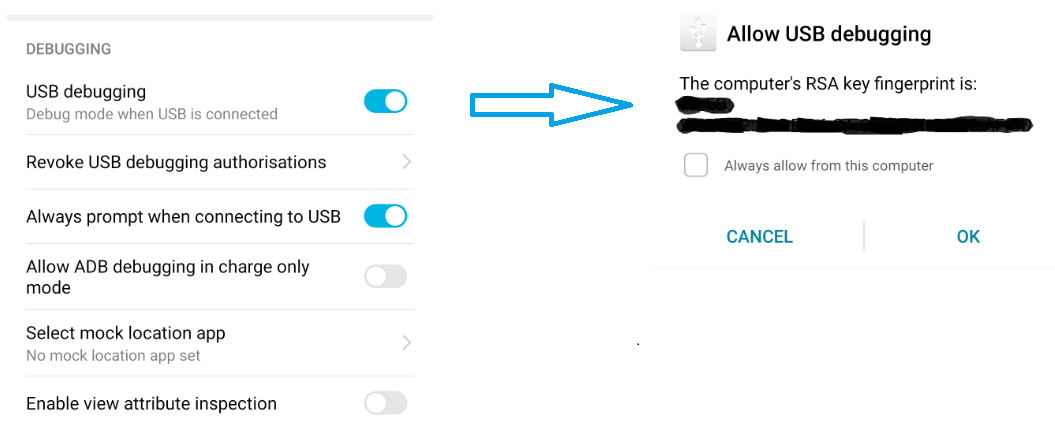
Note: Android 4.4 or higher is required for debugging. Android 2.x and 3.x devices do not support USB debugging.
Set the stage for Website Debugging
- Launch Chrome browser on your android device and leave it alone.
- In your connected PC/Laptop, Launch Chrome Browser and Press the F12 key to launch the debugger.
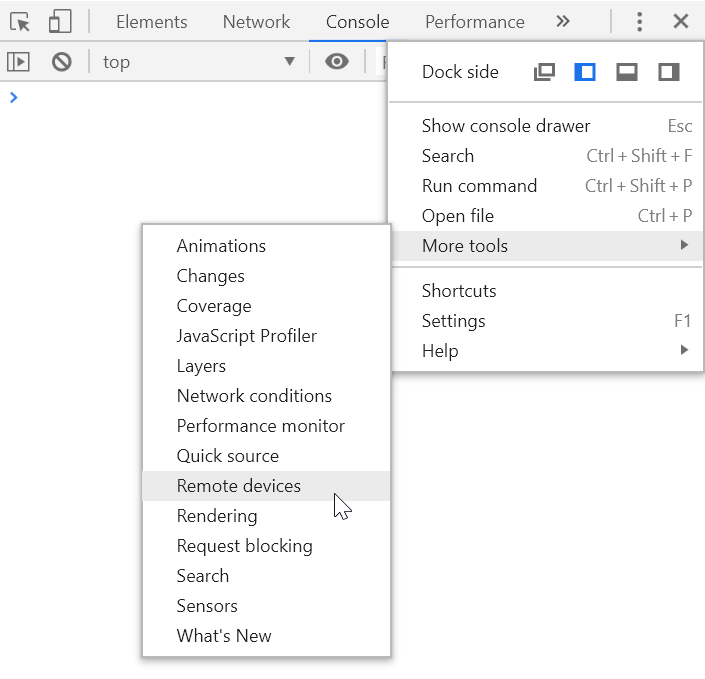
Open the Remote devices option from three dots menu, as it is shown below:
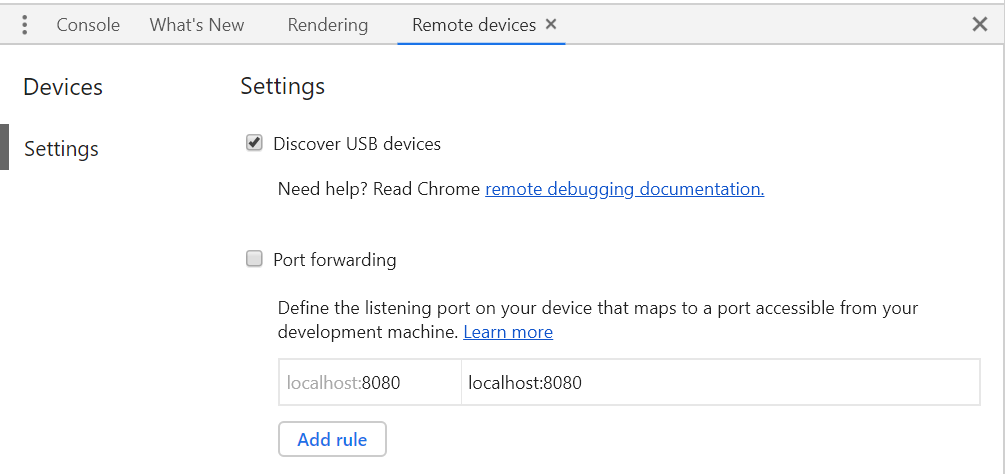
You should see the Discover USB devices option selected:
In the next few seconds, your device will be discovered and should show as connected like this:
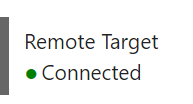
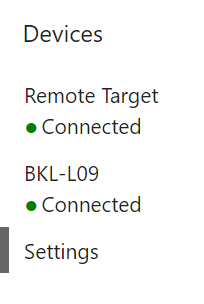 In the above image, BKL-L09 is the identification of my Android Phone.
 Click on the Phone Identification number(In my case, it is BKL-L09). You should see the option to provide the website URL you would like to launch to debug. What could be better than Inspecting my Blog site 😄😄😄?
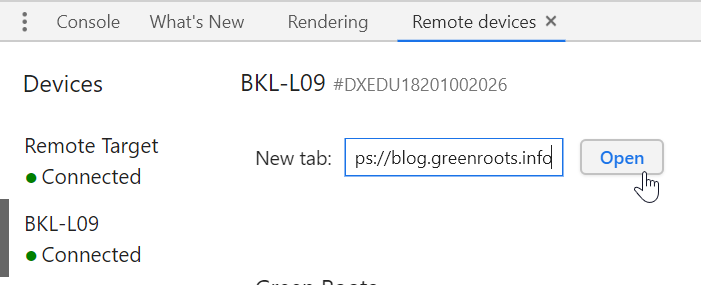
At this time, you should see the same website opened in your device's Chrome Browser automatically. As the last step, click on the inspect button as shown below:

Final Stage
You are all set. You should see a separate debugger window has been opened by launching your website. This time, it is connected to your device's browser!
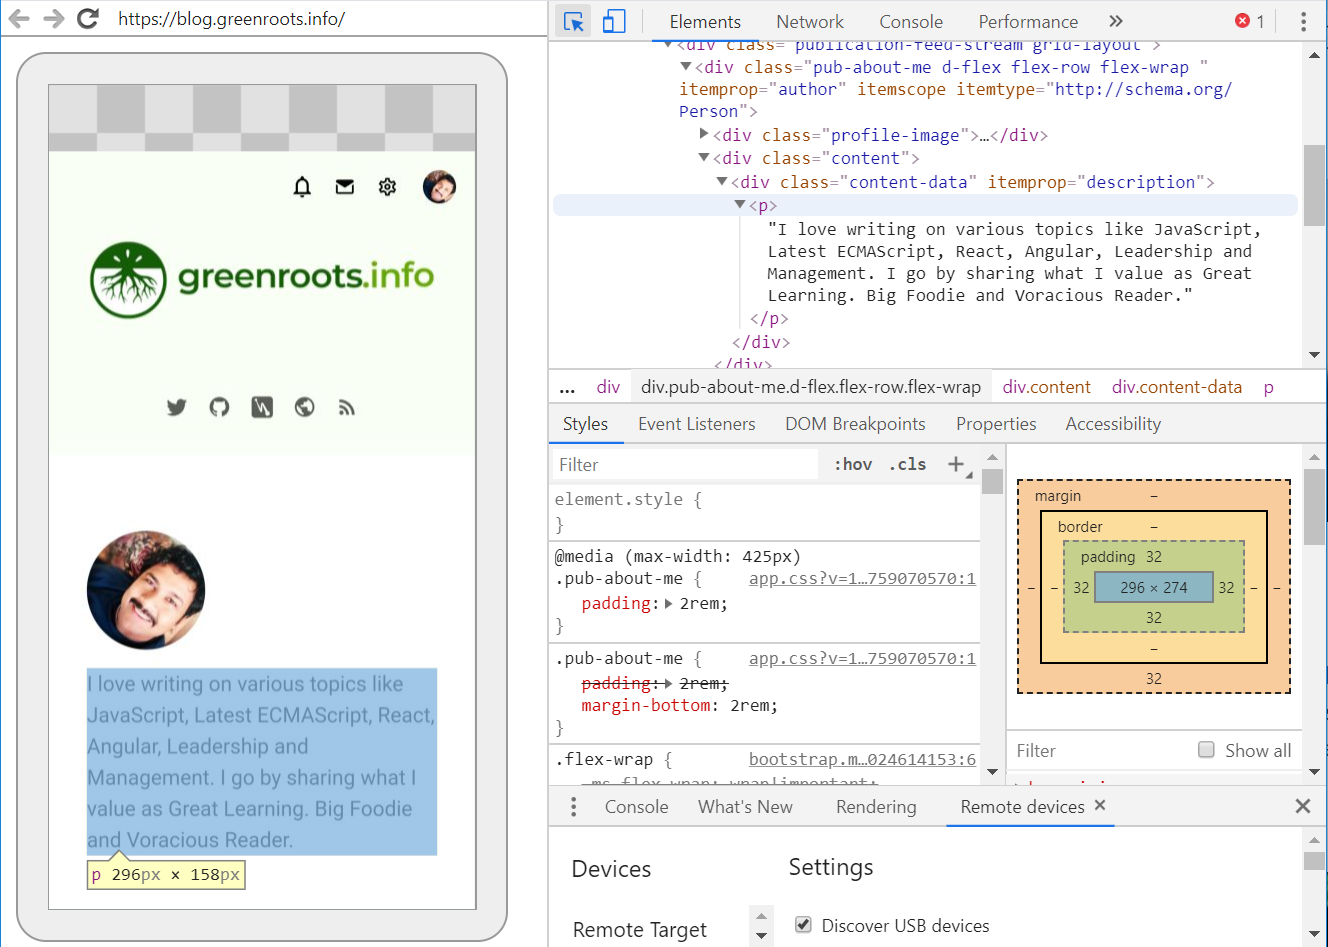
Notice that you can see the same in the debugger tool. Awesome.
Demonstration
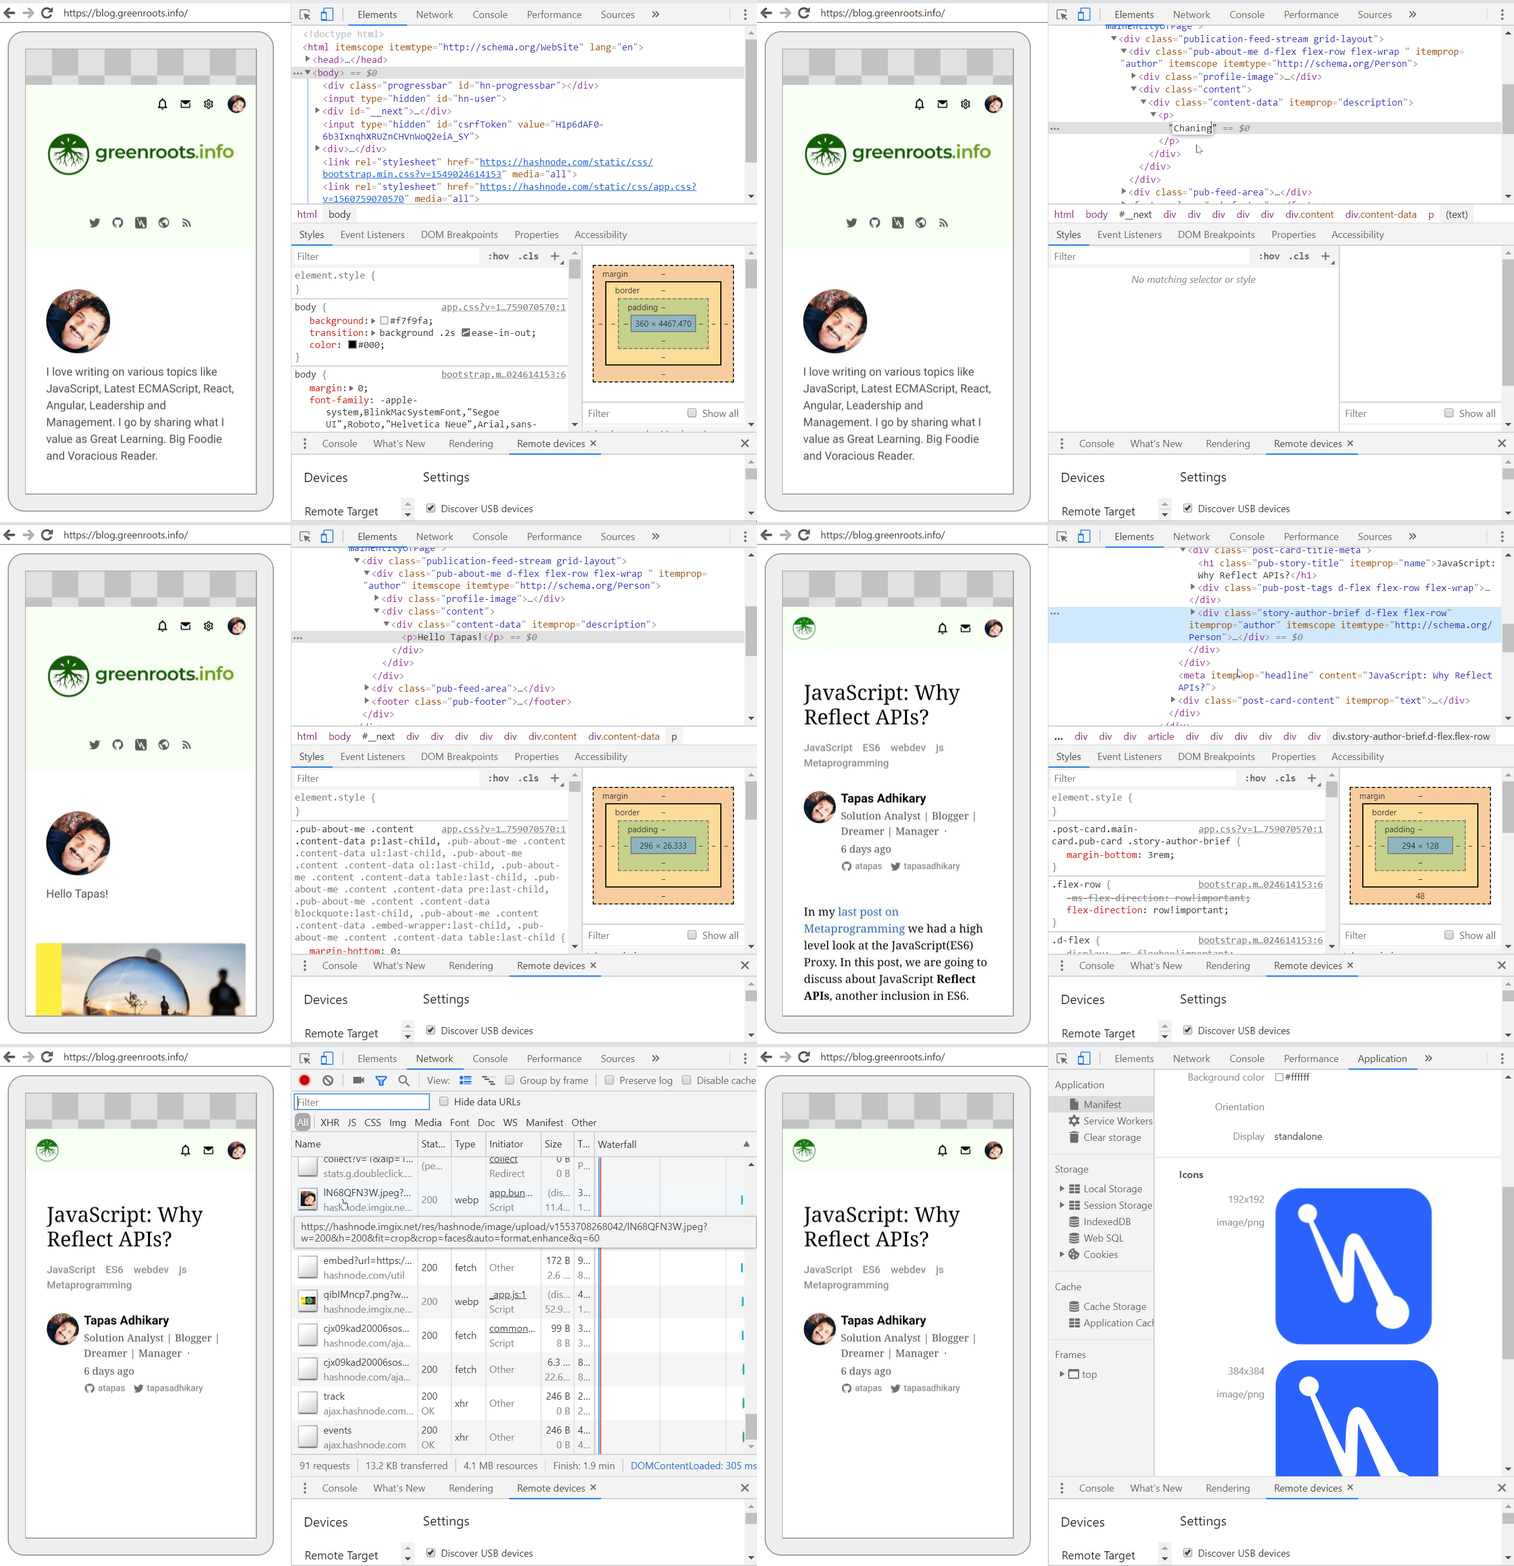
Here is a small demonstration of how you will use it to inspect, change DOM, Debug Network Calls, etc.
Please note: You are still inspecting and debugging the website/app launched on the connected mobile device.
Here is detailed documentation from Google with Troubleshooting Steps:
I hope you Like it and this is going to help you in some way. Cheers! 🍺🍺🍺🍺
You may also like,